Background
1. Balancing Pattern and Process
A focal point in the analysis of where and how agroforestry systems work is still whether or not tree-crop systems can utilize resources of light, water and/or nutrients which would not be used in a simpler tree or crop system (Cannell et al., 1996). A fair amount of detail in the description of above- and belowground resource capture by the component species is needed to evaluate both competition and complementarity (Sanchez, 1995; Ong and Huxley, 1996).
Tree-soil-crop interactions occur both in space and time. In ‘sequential’ agroforestry systems neighbourhood effects in a landscape mosaic still have a spatial element, while ‘simultaneous’ systems often have at least an element of zonation. The dichotomy between sequential and simultaneous agroforestry systems may thus have been overstated in the past and a modelling framework is desirable in which they are endpoints of a continuum.
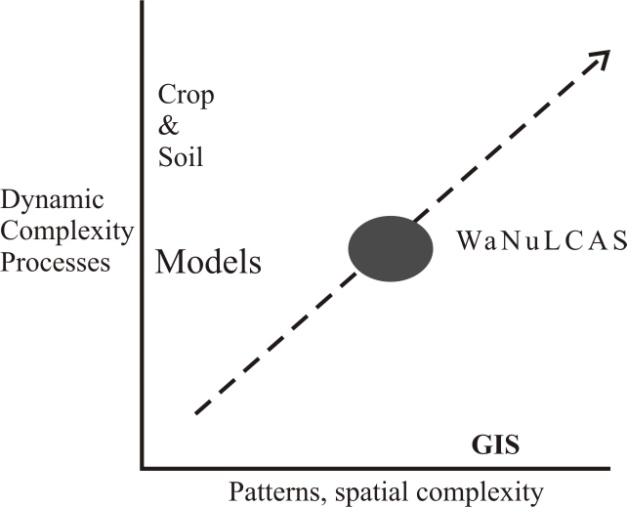
Figure 1.1. Schematic classification of the way crop growth models deal with spatial and temporal complexity; agroforestry models should explore the diagonal, rather than try to introduce spatial patterns in complex process based models.
In modelling agroforestry systems, a balance should be maintained between ‘process’ and ‘pattern’, between temporal and spatial aspects (Figure 1.1). Existing crop growth models tend to be detailed in ‘processes’, but they usually do not take spatial patterns into account. They (implicitly) assume a homogeneous ‘minimum representative’ area, with a one-dimensional variation between soil layers. Most GIS (geographical information systems) applications do not incorporate spatial interactions and estimate the total output of an area as the summation of area times output per unit area, for grid cells which are not dynamically interacting with their neighbours (similar to a ‘stratified’ sampling approach). For representations of agroforestry we need both spatial and dynamic aspects, and should therefore aim at models along the diagonal line in Figure. 1.1. Full-scale detail on spatial interactions may not be achievable for any reasonable process description, however, and it may be best to start in the lower left corner with fairly simple process and spatial descriptions, only to move to the upper right corner where research questions require more detail. As a starting point on the spatial side, we have chosen for a system of ‘zoning’, which can relate many types of spatial patterns to a model still covering essential aspects of real-world behaviour. Spatial interactions, such as shading aboveground and competition for water and nutrients belowground may occur over a range of distances. Instead of a black/white sharp boundary, every tree-crop interface may consist of several shades of grey in between. The zoning system we opt for appears to have the minimum complexity to do justice to such interactions.
In simultaneous agroforestry systems, trees and food crops are interacting in various ways. As both positive and negative interactions occur, optimization of the system will have to be site specific. The most important interactions probably are:
-
Shading by the trees, reducing light intensity at the crop level,
-
Competition between tree and crop roots for water and/or nutrients in the topsoil,
-
Mulch production from the trees, increasing the supply of N and other nutrients to the food crops,
-
Nitrogen supply by tree roots to crop roots, either due to root death following tree pruning or by direct transfer if nodulated roots are in close contact with crop roots,
-
Effects on weeds, pests and diseases,
-
Long term effects on erosion, soil organic matter content and soil compaction.
Interactions 3, 4 and 6 are positive, 1 and 2 are normally negative, and 5 can have both positive and negative elements. The positive and negative effects can interact during the growing season, and this may limit the use of end-of-season summaries of the tree-crop interaction effects. Yet, such summaries are helpful as a first approximation.
2. Tree-Soil-Crop Interactions
The success of any intercropping depends on the balance of positive (facilitation) and negative (competition) interactions between the components Vandermeer (1989). Ong (1995) and Akeampyong et al. (1995) developed a simple equation for quantifying tree-soil-crop interactions (I), distinguishing between positive effects of trees on crop growth via soil fertility improvement (F) and negative effects via competition (C) for light, water and nutrients. Very much simplified, the interaction term is positive and the combined system may make sense if F > C, and not if F < C.
Cannell et al. (1996) attempted to clarify the resource base of the production by both the crop and the tree. Part of the ‘fertility’ effect of the tree is based on light, water and nutrient resources which the tree acquired in competition with the crop (Fcomp); another part may have been obtained in complement to resources available for the crop (Fnoncomp). Similarly, part of the resources acquired by the tree in competition with the crop is recycled within the system and may thus be used by a future crop (Crecycl). Tree products that are not recycled may have direct value for the farmer (Cnonrecycl).
One may argue that Fcomp is based on the same resources as Crecycl and that in the longer run the two terms would cancel. The question whether or not a tree-crop combination gives yield benefits then depends on:
-
the complementarity of the resource use,
-
the value of direct tree products, specifically those obtained in competition, Cnonrecycl, relative to the value of crop products that could have been produced with these resources.
-
the efficiency of recycling tree resources into crop products, specifically for the resources obtained in competition with the crop, Crecycl.
Table 1.1. Three-step approach to analysis and synthesis of tree-soil-crop interactions in simultaneous agroforestry systems. A direct experimental separation of the terms in the equation is combined with quantification of key processes and followed by model synthesis to explore management options and system-site matching (van Noordwijk et al., 1998a).
Yc = Crop yield in interaction |
Y0 + Crop yield in monoculture |
F1 + Direct fertility effect |
Fω + Long term fertility effect |
Cl + Competition for light |
Cw+n + Competition for water and nutrients |
M Micro-climate effects |
|---|---|---|---|---|---|---|
|
Mulch transfer | Residual effect | Tree removal | Root barriers | ||
|
Litter quality, mineralization rates | Functional SOM fractions (Ludox) | Canopy shape, light profiles | Root architecture (fractal branching analysis) | ||
|
W a N u L C A S | |||||
Apart from yield effects of agroforestry, labour requirements have a strong impact on profitability, and for this one should compare additional labour use (eg. tree pruning) and labour saving aspects (eg. weed control). Complementarity of resource use can be based on a difference in timing of tree and crop resource demand. If the tree picks up the ‘left overs’ from the cropping period, as occurs with water in the Grevillea maize systems in Kenya (Ong; pers. comm.) and transforms these resources into valuable products, a considerable degree of competition during the temporal overlap may be acceptable to the farmer. If tree products have no direct value, agroforestry systems may only be justified if Fnoncomp > Cnonrecycl. With increasing direct value of the tree products, the requirements for complementarity decrease.
The efficiency of recycling will depend on the degree of synchrony between mineralization from these organic residues and crop nutrient demand, as well as on the residence time of mineral nutrients in the crop root zone under the site-specific climate and soil conditions (De Willigen and Van Noordwijk, 1989; Myers et al., 1994, 1997).
As light is not stored in ecosystems, complementarity in light use is easy to measure. For water and nutrients complementarity has to consider time scales linked to the ‘residence’ times of the resources in the ecosystem; residence times tend to increase from water, via nitrogen and potassium to phosphorus. For P resources used by the tree it will be difficult to measure whether or not this P might have become available to the crop in the absence of trees. Indications of complementarity in belowground resource use can be obtained by observing the root distribution of both components. Actual uptake of resources will, however, depend on resource and root distribution as well as demand factors, and thus the degree of overlap in root distribution per se is not sufficient to predict competition.
Van Noordwijk (1996a) presented explicit algebraic solutions for an agroforestry model which links both the mulch production and its ensuing soil fertility effect and the shading which is assumed to have a negative effect on crop yields to the biomass production of the tree. The model leads to a simple mulch/shade ratio as a basis for comparing tree species. The model also predicts that at low soil fertility, where the soil fertility improvement due to mulch can be pronounced, there is more chance that an agroforestry system improves crop yields than at higher fertility where the negative effects of shading will dominate. The mulch/shade model, however, does not incorporate the interactions between water availability, N dynamics, crop and tree growth. Incorporating these elements on the basis of a daily time step extends the model beyond what can be solved explicitly and into the realm of dynamic simulation models, which keep track of resource stocks outside and inside the plants and use these to calculate daily resource flows and daily resource capture.
The tree-soil-crop interaction equation can be further analyzed by differentiating between short and long term fertility effects (F1 and Fω, respectively) and by separating the competition term in an above- and a belowground component (Cl and Cn+w, respectively). Van Noordwijk et al. (1998a) described a three-step approach to link these overall terms to experimental treatments, process research and WaNuLCAS as a synthesis model (Table 1.1). The total balance for belowground resources (water or nutrients) inputs into an agroforestry system is:
$\mathrm{\Delta}Stored = Input + Recycle - {Upt}_{crop} - {Upt}_{tree,comp} - {Upt}_{tree,noncomp} - Loss$
[1]
The term Upttree,noncompetitive represents the safetynet function of tree roots for nutrients and water leaching and percolating below the zone of crop roots and/or outside of the crop growing season (Van Noordwijk et al., 1996), as well as a nutrient pump role for resources stored in the subsoil for longer periods of time (Young, 1997).
Table 1.2. Representation of resource capture (equation 1) in a simple tree-crop agroforestry system, where the crop roots are confined to the ‘topsoil’ and the tree roots explore the ‘subsoil’ as well; the subscripts 1, 2 and 3 refer to crop zones with increasing distance to the tree.
| Term in eq. 1 | Water | Nitrogen | Light |
|---|---|---|---|
| Input | Rainfall, irrigation runon-runoff |
Fertilizer & organic imports | Sum of daily radiation |
| Recycle | Hydraulic lift into crop root zone | Litterfall, tree prunings, crop residues | - |
| UptakeCrop | ∑W_Uptakecrop | N_fix(Crop) + ∑N_Uptakecrop | ∑Lightcap_crop |
| UptakeTree,Competitive | ∑subW_Uptaketree | ∑topN_Uptaketree | ∑Lightcap_tree1,2 |
| UptakeTree,Noncomp | ∑subW_Uptaketree | N_fix(Tree) + ∑subN_Uptaketree | Lightcap_tree3 |
| Losses | ∑Percolation from lowest zone | ∑Leaching from lowest zone | 1 - ∑Lightcap |
| ∆storage | ∆Water content | ∆(Nmin & SOM) | - |
In summary, we argue that agroforestry systems do not make much sense from a biophysical point of view, unless there is at least some complementarity in resource capture. Direct empirical approaches to quantify complementarity are possible for aboveground processes, but more complex belowground, as resources there are stored over a longer period of time, making it more difficult to judge whether or not resources could have been used outside an agroforestry context. Models of tree-soil-crop interactions have to pay specific attention to the depth from which each component is capturing water and nutrients on a daily basis, in order to derive overall complementarity on a seasonal basis.
3. Intercropping, Crop-Weed and Agroforestry Models
Attempts to link separately developed crop models into an ‘intercropping’ model have not been very successful yet (Caldwell et al., 1996). A possible reason for this is that accurate description of both above- and below ground resource capture is more critical in a competitive situation than in a monoculture. Aboveground canopy structure does not matter in a monoculture as long as total LAI is predicted correctly. A coarse approximation of the allocation of current uptake of water and nutrients from the soil profile can be good enough, if the resources not used today still remain in the soil on the next day. In a competitive situation, however, it matters where the leaves of each component are relative to those of other components; belowground resources not utilized today may have been taken up by other components before tomorrow. It thus appears that a reasonable performance of a crop growth model in a monoculture situation is a necessary condition for expecting it to perform in intercropping, but not a sufficient condition. Additional detail may be needed to get above- and belowground resource capture correct.
Kropff and Van Laar (1993) gave an overview of models for crop-weed interactions: such models tend to emphasize the phenology of the species competing for resources, as they are meant to help in predicting the effect of interventions (weeding) at different points in the crop life cycle. Otherwise, crop-weed models differ only in name from intercropping models, as both describe resource capture in a system where at least two plants are interacting.
In intercropping models, however, both components have direct value to the farmer, whereas in crop-weed systems the ‘weeds’ have no direct value at all (although they may help in conserving nutrients in the system and reducing losses by leaching). Agroforestry models have to include a two-plant interaction (Figure. 1.2), similar to intercropping and crop-weed models, but differ in that one of the plants is a perennial species. Part of the inspiration for an agroforestry model may thus come from existing tree or forest models.
Rather than linking existing tree and crop models, an alternative approach is to develop a generic plant-plant interaction model. The focus should be on above- and belowground resource capture and its interplay (Figure. 1.3). Specific parameters for each component can be derived from more specialized component models, such as drivers for physiological development (onset of flowering, internal redistribution in generative stage). The model should, however, give a fair description of ‘architecture’ (spatial distribution of the relevant organs) above- and belowground and their consequences for uptake. A correct account of the spatial distribution of organs for resource capture is probably more important in plant-plant interaction models than it is in models for monocultural stands.
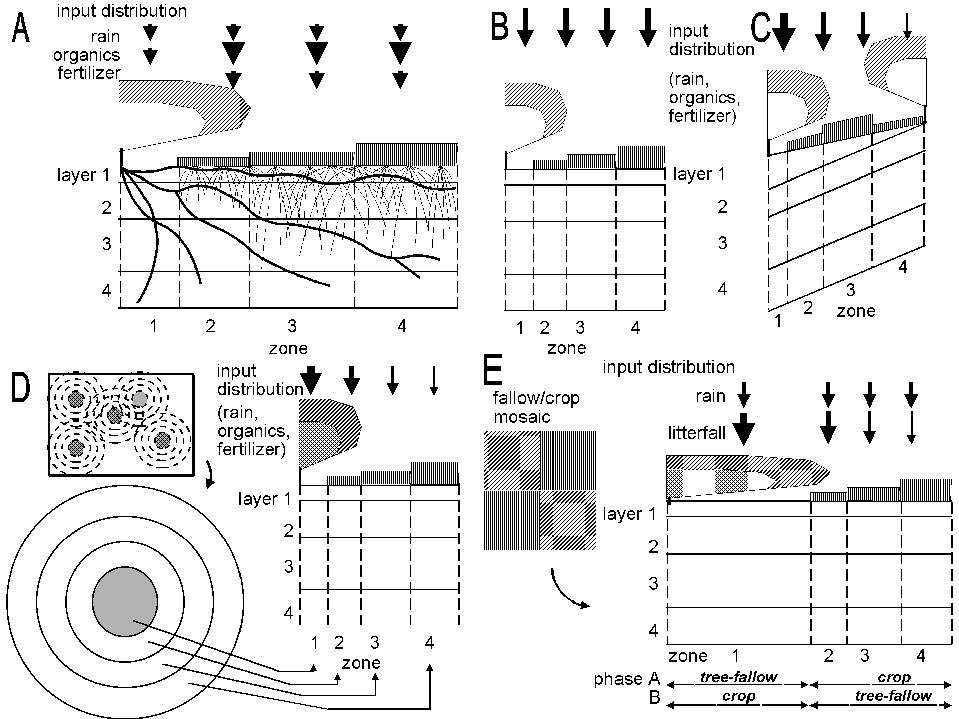
Figure 3.1. General lay out of zones and layers in the WaNuLCAS model (A) and applications to four types of agroforestry system: B. Alley cropping, C. Contour hedgerows on slopes, with variable topsoil depth, D. Parkland systems, with a circular geometry around individual trees, E. Fallow-crop mosaics with border effects.
A major problem in linking a number of single-species resource capture models into a multi-species resource capture model with a single accounting systems for the resources, is one of priority assignment in the calculation sequence. Models which consistently assign priority to one of the components may vastly overestimate its resource capture, while the solution of some models of alternating priorities is not very satisfactory either (Caldwell et al., 1996).
For a more balanced approach, the resource capture of the various components should be further integrated and applied simultaneously, avoiding priority assignment. One way of doing this is adding the root (for water and nutrients) and leaves in a common layer or zone, calculating a total resource capture and sharing this out over the two (or more) components in proportion to their root length density or leaf area. As resource capture is in most cases a non-linear function of root length or leaf area, this approach to resource sharing gives a different result from adding resource capture for the two components (the latter may overestimate potential uptake rates).
4. Objectives of the WaNuLCAS Model
In developing a generic model for water, nutrient and light capture in agroforestry systems (WaNuLCAS), we aimed at a model which would:
-
integrate knowledge and hypotheses on below‑ and aboveground resource capture by trees and crops (or any two (or more) types of plants) at patch scale (the smallest ‘self-contained’ unit for describing the tree/crop interaction) as a basis for predicting complementarity and competition,
-
build on well-established modules (models) of a soil water, organic matter and nitrogen balance, and crop and a tree development to investigate interactions in resource capture,
-
describe the plant-plant interaction term as the outcome of resource capture efforts by the component species, as determined by their above- and belowground architecture (spatial organization) as well as physiology,
-
be applicable to spatially zoned agroforestry systems as well as rotational systems,
-
avoid where possible the use of parameters which can only be derived by fitting the model to empirical data sets and maximize the use of parameters which can be independently measured
-
be flexible in exploring management options within each type of agroforestry system,
-
be useful in estimating extrapolation domains for ‘proven’ agroforestry techniques, as regards soil and climate properties, as well as tree and crop architecture,
-
be user-friendly and allow ‘non-modelers’ to explore a range of options, while remaining open to improvement without requiring a complete overhaul of the model,
-
generate output which can be used in existing spreadsheets and graphical software,
-
make use of readily available and tested modeling software.
In view of objectives 8, 9 and 10 we chose the Stella Research modeling shell (Hannon and Ruth, 1994) linked to Excel spreadsheets for data input and output. The current model should be seen as a prototype; in the Stella environment it is relatively easy to modify or add modules or relationships.
Models can be of value (‘validated’ in the original sense of the word) if a) they adequately reflect the major assumptions one would like to make about component processes, if b) they operate smoothly in the parameter range where one would like to use them, and/or if c) their quantitative predictions agree with measured results in specific experiments (Van Noordwijk, 1996b). Before model validation is undertaken, (1) the purpose of the model, (2) the performance criteria and (3) the model context must be specified (Rykiel, 1996). At this stage we have concentrated on levels a and b of the validation process. WaNuLCAS model is meant as a prototype model, not including all possible tree-soil-crop interaction relationships that one can imagine, but incorporating a core of relations which we are fairly sure of for each specific case. In this sense the model can be viewed as a ‘null model’ (Gotelli and Graves, 1996) which can be used like a null hypothesis as a background against which specific data sets can be tested. The open modeling frame will allow users to add other relationships when and where they wish. Muetzelfeldt and Taylor (1997) have translated WaNuLCAS into a new modelling platform Agroforestry Modeling Environment (AME) as a platform. This modelling environment is now called SIMILE and is currently used in developing FLORES model. The European sylvo-arable agroforestry project SAFE is developing a model with greater spatial articulation HiSAFE.
Further information on agroforestry models can be found on the following web sites:
-
http://www.montpellier.inra.fr/safe/ for news on the HiSAFE model currently under development
-
http://www.wiz.uni-kassel.de/ecobas.html for database of ecological models
-
http://www.ierm.ed.ac.uk/simile/ for SIMILE – previously named AME – Agroforestry Modelling Environment
-
http://simulistics.com/projects/flores/ for FLORES model
-
http://www.forestresearch.co.nz/topic.asp?topic=AEM&title=Agroforestry%20Estate%20Model for Agroforestry Estate Model, a Windows application which projects physical and financial yields for an agroforestry project